

Top Forex Trading Books for Kenyan Traders
📚 Discover the best forex trading books tailored for Kenyan traders. Learn how to pick resources that match your style and boost your market skills! 🇰🇪
Edited By
Sophie Walker
In forex trading, resistance and support are fundamental concepts every trader must know. These terms describe key price points where currency pairs tend to pause, reverse, or even break through, shaping traders' decisions on when to enter or exit trades.
Support is the price level where demand tends to stop a currency from falling further. Picture it like the floor beneath a trader’s feet; prices rarely drop below this point easily. For instance, if USD/KES dips repeatedly to KS10 but doesn’t fall further, that level acts as support.
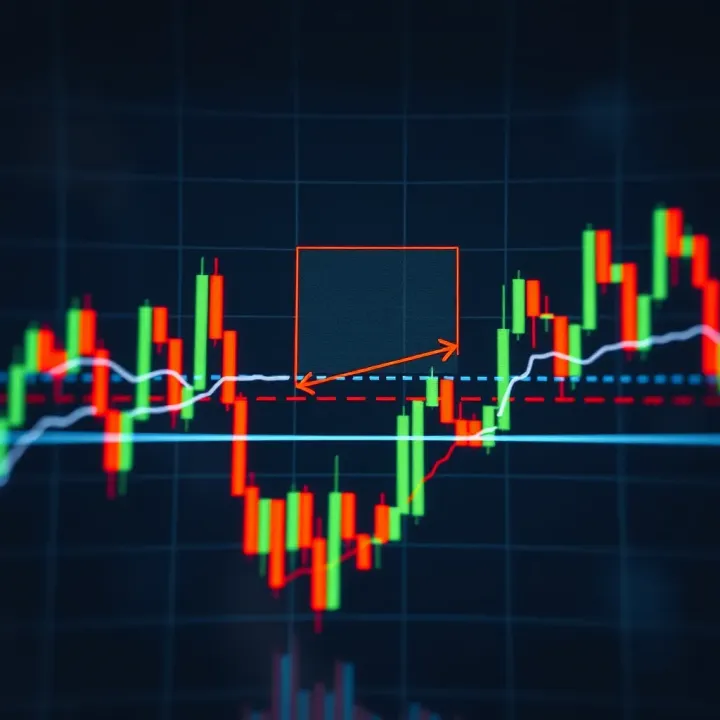
On the other hand, resistance is the ceiling where selling pressure prevents prices from rising further. Think of it as the roof under which price struggles to break out. For example, if EUR/USD rises to 1.10 multiple times yet fails to move higher, 1.10 is serving as resistance.
Spotting these levels helps you avoid entering trades at bad times and gives clues about market sentiment.
Resistance and support come from traders’ psychology, supply and demand dynamics, and past price behaviour. They reflect points where many sellers or buyers have historically stepped in, thus creating barriers.
Understanding these levels helps you anticipate price movements. If a currency pair approaches support and bounces back, you might consider buying with an expectation of upward movement. Conversely, if the pair nears resistance and struggles, it might be the moment to sell or wait.
Identifying support and resistance is not always clear cut but involves analysing charts for:
Previous highs and lows
Price clusters where the market pauses
Psychological round numbers like 110 or 1.20
Moving averages or trend lines that act as dynamic support/resistance
In Kenya’s forex market, where currencies like USD/KES are popular, picking up these levels on charts can give you an edge over others. They’re tools every trader should have in their kit to manage risk despite market volatility.
In the next sections, we will look at practical methods to spot these levels and apply them to real trading scenarios for better decision-making.
Resistance and support levels are fundamental concepts in forex trading, acting like invisible walls that prices tend to bounce off or break through. Understanding these levels helps traders make clearer decisions on when to enter or exit trades, and also when to tighten risk controls. In Kenya's forex market, where currency pairs like USD/KES are widely traded, recognising these levels means you can better anticipate shifts triggered by economic announcements or market sentiment.
Resistance is the price level where selling pressure strengthens enough to prevent the price from rising further. Think of it as a ceiling that stops the price from climbing higher, at least temporarily. For instance, if the USD/KES pair consistently struggles to move beyond KSh 115, that price acts as resistance. Traders observe such ceilings to identify points where sellers may step in, creating opportunities to sell or book profits before prices fall.
This ceiling isn't permanent; when demand eventually overcomes supply at resistance, it could lead to a breakout, signalling a new higher price range. But recognising resistance helps avoid buying at inflated prices likely to dip soon.
Support, by contrast, is like a floor that prices rarely fall below because buying interest picks up at that level. In practice, if the USD/KES rate falls towards KSh 110 multiple times and then bounces back, KSh 110 serves as a support level. Buyers see it as a bargain zone; many are ready to enter trades here, which stops prices from tumbling further.
Knowing support levels helps traders avoid selling when the price is near this floor, as the chance of a rebound is higher. It also guides setting stop-loss orders just below support to limit losses if the floor breaks and prices slide lower.
Resistance and support shape the path prices take over time. Prices tend to oscillate between these levels, creating patterns that experienced traders track for entry and exit points. A clear example is the British Pound to Kenyan Shilling (GBP/KES). If the pair hits support at KSh 145 and resistance around KSh 150, traders expect the price to move within this range before deciding the next move.
Traders who understand these zones can better predict likely price reactions, making their trades timely and potentially more profitable.
These levels also influence how traders feel and act. When prices approach resistance, some traders grow cautious, fearing a reversal, and may sell off their holdings. Others position their trades to profit if prices finally break the ceiling. Similarly, near support, traders might feel confident about buying, expecting prices to rise again.
This collective psychology turns resistance and support from mere numbers on charts into dynamic battlegrounds of buying and selling forces. Recognising when emotions like fear or greed influence price around these levels can help traders stay rational and avoid knee-jerk decisions.
Knowing resistance and support is like having a weather forecast for price movements—it doesn’t tell you everything, but it prepares you for likely changes ahead.
Understanding these basics of resistance and support creates a foundation for making smarter trading choices, especially in the fluctuating environment of forex markets in Kenya and beyond.
Identifying resistance and support levels on forex charts lies at the heart of effective trading. These levels indicate where price movement often pauses or reverses, helping traders plan entries, exits, and manage risks. By watching price patterns on historical charts, traders spot key areas where demand or supply overwhelms the opposite force, giving clues on possible future behaviour.
Historical price data provides concrete reference points for resistance and support. Previous highs tend to act as resistance, where sellers step in and push prices down. On the flip side, previous lows often serve as support, where buyers increase demand to hold prices from falling further. For example, if the USD/KES pair consistently fails to rise above KSh 110.50 over several trading sessions, that level becomes a key resistance to watch.
Identifying these points isn’t just about marks on the chart; it’s recognising the market’s memory. Traders often test these levels repeatedly — each test reinforcing their significance. Keeping an eye on these historic highs and lows can reveal patterns about where new price ceilings or floors might form.

Volume refers to the number of trades or contracts exchanged over a period. It’s a powerful way to confirm the strength of resistance or support levels. When price hits these levels with rising volume, it suggests that many participants recognise and react to those zones, reinforcing their importance.
For instance, suppose the EUR/USD dips towards a support level, and volume spikes significantly. This increase implies strong buying interest at that support. Conversely, if price approaches resistance and volume falls, it may suggest weak selling pressure, which could lead to a breakout. Kenyan traders using platforms like MetaTrader can easily monitor volume alongside price to make informed decisions.
Trendlines connect successive highs or lows to outline the market's direction. Drawing a line along rising lows highlights an uptrend support, whereas a line across falling highs marks resistance in a downtrend. Channels, which are parallel trendlines, define a price corridor where moves tend to bounce between support and resistance.
For example, in the USD/UGX (Ugandan shilling) market, a trader might observe a steady uptrend channel where price regularly bounces off the lower support line. Spotting these patterns guides traders on when to enter trades near support and take profits near resistance.
Moving averages smooth out price data to highlight trends and potential support or resistance zones. Common periods are 50-day and 200-day moving averages, which many market players watch closely. Price often respects these averages, bouncing off them or facing resistance near them.
In Kenyan forex markets, a trader might notice that the KES/USD pair tends to find support around the 50-day moving average during pullbacks. Recognising this helps in timing entries better than guessing based on raw price alone.
Pivot points are calculated price levels derived from the previous day’s high, low and close. They serve as potential support and resistance zones for the current trading day. Many day traders use pivot points to identify where the price might pause or reverse within daily trading.
Using pivot points, a BTC/USD trader in Nairobi, for example, can quickly find intraday support and resistance without scanning multiple chart timeframes. This enhances quick decision-making in fast-moving markets.
Properly spotting and confirming resistance and support levels with these tools provides a clearer view of market sentiment, enabling smarter trades. Nigerian forex traders and those across East Africa rely on such techniques to adjust to local market quirks and manage risk effectively.
Traders in forex markets often rely on resistance and support levels to make informed decisions. These price points help mark where currencies tend to stall or reverse, and combining them with sound trading strategies can improve the chance of success. Applying specific trading tactics at these levels allows traders to enter and exit trades with greater confidence, helping to maximise profit and manage risk effectively.
When price approaches a support or resistance level, it often ‘bounces’ off rather than breaking through immediately. Traders look for signs that prices are holding these levels to enter trades in the expected direction. For example, if the USD/KES pair approaches a support zone near 110 and shows signs of reversing, a trader might enter a buy position anticipating the price will rise. An exit can be planned just below the next resistance level, protecting gains if the price stalls.
The timing of entry and exit is vital. Entering too early risks catching a false breakout, while late entry may reduce profit potential. Watching for confirmation—such as candlestick patterns or volume changes—helps traders pinpoint better moments to step in.
Risk control is crucial when trading bounces off these levels. A common approach is placing stop-loss orders just beyond the support or resistance, limiting loss if the bounce fails. For instance, if entering long at a KES/USD support level of 110, a stop-loss might sit slightly below, say at 109.5, to avoid bigger losses if price drops further.
Sizing the trade according to account balance and market volatility also matters. Smaller positions during higher volatility or uncertain market conditions help protect the trader’s capital. Kenyan traders dealing with fluctuating currency pairs like USD/KES or EUR/KES can benefit from stricter risk rules, especially during economic announcements.
Breakouts occur when price moves decisively beyond resistance or support. However, not all breakouts sustain momentum. True breakouts tend to have increased volume, wider price range on the breakout candle, and follow through in subsequent bars. For example, if the USD/KES breaks above a strong resistance at 115 and closes significantly higher on high volume, this signals a genuine breakout.
Traders must avoid jumping in during false breakouts, which quickly reverse and trap unprepared traders. Waiting for a retest of the broken level or additional confirmations reduces the risk of losses.
Once a breakout trade is entered, stop-loss placement is key to limiting losses if the breakout fails. Typically, stops are placed just inside the old resistance or support level. For example, after a breakout above 115 USD/KES resistance, a stop-loss might be set at 114.7.
Take-profit orders can be set using price targets based on previous swings, measured moves, or trailing to lock in gains as price advances. Kenyan traders who use M-Pesa or bank transfers for forex trading appreciate the automation stop-loss and take-profit orders offer, easing discipline and avoiding losses caused by emotional decisions.
Successful trading strategies around resistance and support hinge on correctly reading price action and tight risk management. Whether trading bounces or breakouts, combining clear entry rules with stop-loss discipline is key to consistent results.
This practical approach helps Kenyan traders navigate forex markets confidently, especially amid regional economic uncertainties and currency fluctuations.
Resistance and support are vital tools for traders, but they often come with pitfalls that can mislead even experienced Forex players. Recognising these challenges helps avoid costly errors and improves trading results. Kenyan traders, particularly those dealing with volatile currency pairs like USD/KES, should pay close attention to these aspects to safeguard their investments.
False breakouts happen when prices briefly move beyond a resistance or support level but then quickly reverse, tricking traders into premature entries or exits. In the fast-moving Forex market, especially during times of low liquidity like early mornings in Nairobi, this can cause losses. To avoid this, you should watch for sustained price action beyond the level, rather than reacting to a single candle or quick spike.
Traders might think the price has broken resistance only to see it falling back below, a classic case of market noise. Practically, using a timer or waiting for a close above or below a level on your chosen timeframe can be more reliable than chasing instant moves.
Confirmation signals help verify whether a breakout is genuine. For example, the rise in trading volume accompanying a breakout suggests real momentum behind the move. Similarly, tools like the Relative Strength Index (RSI) can indicate if the price is overbought or oversold, guiding traders on whether to trust the breakout.
Using multiple confirmations lowers the risk of falling for trick moves. For instance, a Kenyan trader might wait for both a breakout past resistance on the chart and a simultaneous spike in volume on the MT4 platform before opening a trade. These signals act like a safety net against the wild swings common in Forex.
Relying only on resistance and support can be risky because price behaviour often depends on various factors. Combining indicators such as moving averages, MACD (Moving Average Convergence Divergence), or Fibonacci retracements gives a fuller picture. For example, if the price breaks support but the moving average suggests an ongoing trend reversal, a trader should think twice before entering a position.
In Kenyan markets, where sudden economic news can shake currency pairs, layering these tools aids in making better-informed decisions instead of guessing solely based on horizontal lines.
Market context includes economic reports, geopolitical events, or even informal factors like election seasons or harvest outcomes that can influence currency strength. Simply trading resistance and support without considering these elements might miss the bigger picture.
For example, a breakout past resistance on USD/KES during an important Central Bank meeting might be more meaningful than one during a quiet weekend. Kenyan traders should always respect the broader context by monitoring news feeds alongside their charts.
Getting caught in false breakouts or ignoring the wider market environment can turn promising trades into painful losses. Using confirmation signals and multiple indicators while considering current events helps create a more reliable trading approach.
By being alert to these common challenges, traders in Kenya and beyond can improve their skill in applying resistance and support effectively, increasing their chances of success in Forex trading.
Understanding how resistance and support work within the Kenyan forex market can help you trade more effectively. Kenyan forex traders face unique conditions influenced by regional economic activities, currency preferences, and local trading platforms. Applying these concepts here means recognising how local factors shape price behaviour and adjusting your strategies accordingly.
Kenya's economic events often move the forex market in ways that might surprise traders used to global standards. For example, Central Bank of Kenya (CBK) interest rate announcements can cause sudden swings in the Kenyan shilling against major currencies. Weather patterns affecting agriculture or political developments around election periods also impact the forex market locally.
These events can create new resistance or support levels not immediately apparent on longer-term charts. A drought report may weaken the shilling, pushing it past typical support zones quickly. Thus, trading in Kenya means constantly watching for these regional factors to anticipate when price levels might break or hold.
Kenyan traders mostly focus on pairs involving the Kenyan shilling (KES), US dollar (USD), and sometimes emerging currency pairs like the Ethiopian birr or South African rand. Each currency pair has its own behaviour influenced by trade flows, remittances, and cross-border business.
For example, the USD/KES tends to react strongly to Kenyan economic data or political news, creating sharp but sometimes short-lived resistance and support zones. Whereas pairs like USD/ZAR might follow broader African market trends. Knowing which pairs are popular and how local factors affect them helps you spot more reliable levels on charts, improving the precision of your trades.
Kenyan traders benefit from M-Pesa's ubiquity for quick deposits and withdrawals with forex brokers. Being able to deposit KSh funds instantly helps you enter or exit trades fast when price hits your support or resistance levels. Some Kenyan brokers also integrate M-Pesa into their platforms, making execution smoother.
Besides M-Pesa, digital platforms like MetaTrader and cTrader are widely used, offering handy tools for marking resistance and support directly on charts. Utilizing these gives you an edge by combining timely fund movements with technical setups.
Forex trading in Kenya is governed by rules meant to protect investors, including limits on retail leverage and mandatory KRA (Kenya Revenue Authority) tax compliance. Understanding these helps you manage risk effectively.
For instance, leverage limits enforced by the Capital Markets Authority (CMA) mean you should size your positions conservatively even when a support or resistance level looks strong. Also, ensure your trading profits are declared properly through iTax to avoid issues later.
Successful trading in Kenya means blending global chart concepts like resistance and support with local realities—economic events, currency pair nuances, digital payments, and regulatory rules.
By applying these insights, you become a sharper trader who can navigate the Kenyan forex market confidently and responsibly.
📚 Discover the best forex trading books tailored for Kenyan traders. Learn how to pick resources that match your style and boost your market skills! 🇰🇪

📱 Discover the best forex trading apps for Kenyan traders! Learn how they work, find trusted providers, spot key features, stay secure, and trade smarter today.

🔍 Learn the best times for forex trading in Kenya 🇰🇪! Explore global sessions, peak volatility, and smart timing strategies to boost your trading success 📈.

Explore top forex trading platforms for Kenyan traders ⭐ Compare features, ensure security 🔒 and boost your trading efficiency with this practical guide!
Based on 7 reviews