

Understanding Candlestick Patterns for Smarter Trading
📊 Learn how candlestick patterns reveal market moves in Kenya's trading space. Spot trends, master common types, and trade smarter with key tips.
Edited By
Isabella Turner
Reversal candlestick patterns are a key tool in trading, helping you spot when the market might change direction. In Kenya’s markets, where volatility can be high and news events swiftly affect prices, recognising these patterns gives traders a better chance to time their entry and exit points.
Candlesticks originated from Japanese rice traders centuries ago and have since become popular worldwide, including in Nairobi Securities Exchange (NSE) trading rooms. Each candlestick shows four important data points: open, close, high, and low prices for a given period. By studying sequences of these candles, traders can detect shifts in buying and selling pressure.
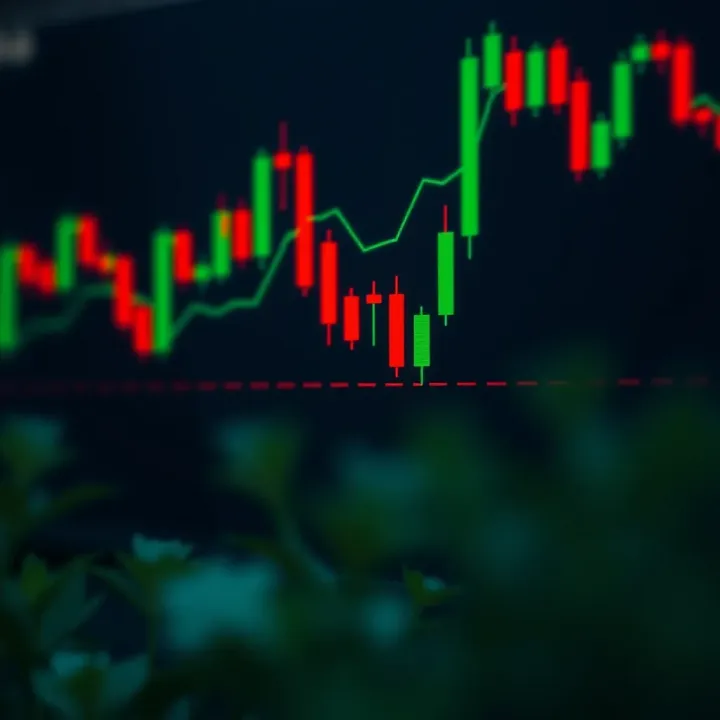
Common reversal patterns include the Hammer, Shooting Star, Engulfing, and Doji. For example, a Hammer forming after a downtrend tells you that bears might be losing strength and bulls could be taking over—suggesting a potential price rise ahead. Similarly, a Shooting Star appearing after an uptrend indicates sellers could regain control, signalling a possible drop.
Spotting reversal candlestick patterns within the wider market context is essential. Patterns alone don’t guarantee success; consider volume, recent price action, and overall market sentiment, especially in Kenya where external factors such as political announcements or economic data releases often affect price swings.
To use these patterns effectively:
Watch for their appearance at key support or resistance levels
Confirm with trading volume; bigger volume usually validates the signal
Combine with other tools like moving averages or RSI (Relative Strength Index) for confirmation
Avoid common mistakes like relying on a single candlestick to predict trends or ignoring the broader market context. Kenyan traders should also be wary of false signals during low liquidity periods, such as school holidays or market closures.
In summary, understanding reversal candlestick patterns can boost your trading edge by revealing potential trend changes early. These visual cues, paired with other market analysis, help you navigate investments with more confidence in fast-moving Kenyan markets.
Reversal candlestick patterns signal a potential change in market direction. They help traders anticipate whether an existing trend might stall or turn. For example, on the Nairobi Securities Exchange (NSE), spotting a reversal pattern in a popular stock like Safaricom could inform you when to take profits before a price dip or enter a position ahead of a rally. These patterns play a practical role in shaping buy or sell decisions and in managing risks.
A candlestick shows price movement for a given period, such as a day or hour. It has a body and two shadows (also called wicks). The body represents the opening and closing prices, while the shadows mark the highest and lowest prices during that period. If the body is long, it means strong price movement within that timeframe; a short body suggests little change. This visual structure makes it easier to understand market moods at a glance.
A bullish candle closes higher than it opens, often drawn in white or green, indicating buyers pushed the price up. Conversely, a bearish candle closes lower than it opens and is typically black or red, showing sellers took control. Recognising these helps you gauge whether buyers or sellers had the upper hand in each period, aiding decisions like when to enter or exit trades.
A trend reversal occurs when the direction of prices shifts from an uptrend to a downtrend, or vice versa. For instance, after a sustained rise in Equity Bank shares, spotting a reversal pattern might hint that selling pressure is increasing and prices could soon drop. Reversals are vital because they suggest profitable trading opportunities by signalling the end of one trend and the start of another.
Incorporating reversal candlestick patterns strengthens trading strategies by offering timely entry and exit signals. They act as early alerts, so you don’t wait for full trend confirmation, which might be too late. For example, combining reversal patterns with other Kenyan market tools like volume data or moving averages can give you a clearer edge in a volatile market. This helps you protect profits and reduce losses, especially in unpredictable conditions like during election periods or economic shifts.
Recognising reversal candlestick patterns lets traders act smartly before markets fully change direction, which is key to staying ahead in Kenya's dynamic trading environment.
Recognising key reversal candlestick patterns helps traders identify when a market trend might change direction. These patterns provide clear signals to enter or exit trades, reducing guesswork. Knowing which patterns to watch for is especially useful in fast-moving markets like Kenya’s, where timely decisions matter. Practical use of these patterns can improve risk management and give traders an edge.
The Hammer and Hanging Man look similar but appear in different contexts. A Hammer forms at the bottom of a downtrend and hints the market might turn bullish. It has a small body and a long lower wick, showing that sellers pushed prices down but buyers stepped in before the close. For example, if KCB Group’s share price shows a Hammer after a drop, it signals potential recovery.
On the other hand, a Hanging Man appears at the peak of an uptrend. It also has a small body and long lower wick but warns that buying pressure might be weakening, and sellers could soon take over. Spotting this pattern on Safaricom’s charts might prompt traders to prepare for a downturn or tighten stop losses.

The Shooting Star signals a possible reversal after an uptrend. It has a small body at the lower end of the range with a long upper wick, indicating that buyers pushed prices up but couldn’t hold them near the close. This pattern suggests bears are gaining strength. For instance, if Equity Bank’s stock forms a Shooting Star, traders might consider short positions or profit-taking.
Conversely, the Inverted Hammer appears after a downtrend. Its small body and long upper wick imply buyers are attempting to push the price upward, possibly marking the start of an upward move. A good example would be an Inverted Hammer on the NSE 20 share index signalling a potential local market rebound.
An Engulfing Pattern involves two candles where the second candle completely covers or ‘engulfs’ the first. A Bullish Engulfing happens at a downtrend’s bottom when a large green candle covers a smaller red one, signalling buying strength. For example, Nation Media Group shares showing this might indicate a positive trend shift.
A Bearish Engulfing forms during an uptrend with a big red candle overtaking a smaller green candle, suggesting selling pressure is increasing. Traders could use this to anticipate price pullbacks, such as in the case of prices rising too fast on Bamburi Cement.
The Harami Pattern sees a large candle followed by a smaller candle fully inside the previous candle’s body. A Bullish Harami, with a small green candle inside a large red one, suggests the downtrend might lose momentum. This pattern is less aggressive but useful in confirming other signals. For example, its appearance on a Nairobi Securities Exchange stock chart might hint at a gradual price recovery.
A Bearish Harami, with a small red candle inside a large green one, hints a pause or possible reversal in an uptrend, signalling caution.
The Morning Star consists of three candles—a long red candle, a small-bodied candle (indecision), then a long green candle. This setup shows a strong shift from sellers to buyers, often confirming a bullish reversal. Kenyan traders might spot this in Safaricom’s shares during correction phases.
The Evening Star is the opposite: a long green candle, an indecisive small candle, then a long red candle, signalling a possible bearish reversal. Recognising these stars helps traders anticipate market turning points more confidently.
Understanding these key reversal candlestick patterns equips you to make smarter trading calls by recognising early signs of trend shifts and adjusting your strategies accordingly.
Reversal candlestick patterns do not exist in isolation; interpreting them within the broader market context is vital for making sound trading decisions. These patterns are signals that market sentiment might be shifting, but verifying their validity requires considering additional factors such as trading volume and other technical indicators. For example, spotting a hammer candlestick on a Nairobi Securities Exchange (NSE) stock chart is promising, but confirming if it points to an actual reversal depends on supporting market data.
Trading volume reflects the number of shares or contracts traded during a given period and offers insight into the strength behind a price move. A reversal pattern accompanied by high volume carries more weight because it suggests genuine participation by traders. For instance, if an Evening Star pattern forms at the peak of a rally on a popular NSE stock like Safaricom but volume is low, the pattern may lack conviction, increasing the risk of a false reversal.
On the other hand, when a bullish engulfing candle appears on an NSE stock after a downtrend with a significant rise in volume, it indicates strong buying interest. This volume-backed confirmation helps traders act with more confidence, whether they’re entering long positions or adjusting stop-loss levels.
Complementary indicators provide an extra layer of analysis, helping traders avoid acting on signals that might mislead. Commonly used tools include the Relative Strength Index (RSI), Moving Averages (MA), and the Moving Average Convergence Divergence (MACD). For example, spotting a morning star pattern followed by RSI climbing from oversold territory confirms improving momentum.
Moving averages also assist in filtering reversals. If a reversal pattern coincides with the price crossing above a 50-day MA, it supports the likelihood of a genuine trend shift. Similarly, MACD histogram crossing zero alongside reversal formations can reinforce the signal’s reliability.
Not every reversal-looking candlestick pattern signals a true change in trend. One common mistake is ignoring the market context and volume, which leads to premature entry or exit. For example, a shooting star in a volatile market without volume support might just be noise rather than a real top.
Another error is relying only on candlestick shapes without considering overall price action. A reversal pattern at a weak support level with no convergence from other indicators is often prone to failing. Traders who jump solely on such signals may face losses when the market continues its previous direction.
Combining reversal patterns with volume and other technical tools reduces the risk of falling for false signals. Traders should wait for confirmation, such as a follow-through candle closing above or below the reversal, accompanied by volume increase.
Risk management practices like setting sensible stop-loss orders are crucial. For example, placing a stop just below the low of a hammer candlestick limits losses if the expected reversal fails. Also, being patient and not overtrading based on every candlestick save capital from unnecessary exposure.
Always remember, no pattern guarantees success. Using reversal candlestick patterns with volume and technical indicators and managing risk carefully sets you up for smarter, more consistent trading in the NSE and other Kenyan markets.
This approach balances the neat simplicity of candlestick analysis with the complexity of real market behaviour, making your trading decisions stronger and more grounded.
Recognising reversal candlestick patterns on the Nairobi Securities Exchange (NSE) can significantly improve trading decisions for investors focused on Kenya’s unique market characteristics. The NSE experiences varying liquidity levels across sectors and can be influenced heavily by local economic and political news, making technical signals like reversal patterns especially useful for spotting potential trend shifts early.
Case Studies of Kenyan Stocks
By analysing shares like Safaricom Ltd, Equity Bank, or KCB Group, traders can observe how reversal candlestick patterns have historically indicated upcoming price movements. For instance, a hammer pattern forming after a downtrend in Safaricom might suggest a bullish reversal, signaling a good entry point before a price rally. These examples provide concrete references for applying theory into practice using familiar securities.
Lessons from Local Trading Trends
Kenyan markets often react sharply to government policy announcements and earnings reports. Traders have noticed patterns such as the morning star appearing before major positive shifts following budget speeches or central bank interest rate decisions. These lessons reinforce that combining candlestick analysis with awareness of Kenyan macro events creates a more reliable trading approach.
Using M-Pesa and Digital Platforms for Trade Execution
Modern Kenyan traders benefit from platforms like EazzyTrade, where linking M-Pesa for payments allows fast and secure trade execution upon recognising a reversal pattern. This immediacy helps capitalise on signals without delays caused by traditional banking processes. For example, after spotting an engulfing bullish pattern, a quick purchase using M-Pesa means a trader can jump into a position with minimal lag.
Accessing Market Data via Kenyan Brokers
Most brokers operating in Kenya provide real-time price charts alongside analysis tools tailored for local securities. Platforms such as Njorku or African Alliance Capital enable access to volume, price action, and even combine fundamental data, enhancing pattern recognition. Trading software integrated with broker data supports better decision-making by bringing reversal patterns into context within Kenya’s market ecosystem.
Applying candlestick patterns in Kenya’s market environment demands an understanding of local data sources, payment methods, and market drivers. Together they help traders act on patterns efficiently and confidently.
Reversal candlestick patterns are powerful tools, but traders often face challenges when relying solely on them. Understanding these limitations and combining candlestick patterns with sound trading habits can improve decision-making and reduce losses. This section highlights common issues traders encounter and offers practical tips for consistent success.
Market volatility refers to how much and how quickly prices change during a given period. In volatile markets, candlestick patterns can produce misleading signals. For instance, a trading day with sharp price swings might form a reversal pattern that looks promising but gets quickly reversed the next day. Kenyan markets, like the Nairobi Securities Exchange (NSE), can experience sudden swings due to local events such as political announcements or weather impacts on agricultural stocks.
Such fluctuations make it risky to rely solely on candlesticks without checking other market factors. Traders need to be cautious especially during earnings seasons or elections when prices may react strongly and unpredictably.
Macroeconomic news greatly affects market sentiment and can overpower candlestick chart signals. Announcements like interest rate changes by the Central Bank of Kenya, inflation data, or international trade developments can trigger strong moves that negate reversal patterns.
For example, if a bullish reversal pattern appears but the government announces an unexpected tax hike affecting manufacturing companies, the pattern might fail. Traders must stay updated with economic reports and policy changes as these headlines can shift trends faster than technical signals indicate.
Trading reversals requires patience and discipline. Impulsive decisions based on the first sign of a pattern often lead to losses. It's better to wait for confirmation—such as a strong close beyond the pattern or supporting volume—instead of jumping in immediately.
In Nairobi’s market context, many traders rush into trades on rumours but waiting for confirmation can save capital. Consistency comes from sticking to a trading plan and not getting swayed by emotions, especially during volatile market conditions.
Combining candlestick patterns with fundamental analysis provides a clearer picture. While candlesticks tell you about price behaviour, fundamental analysis explains why prices move.
For example, a reversal pattern on Safaricom stock may signal an upward trend, but understanding the company’s latest earnings report, dividend announcements, or sector challenges adds depth to that decision. Relying on both approaches helps traders avoid false signals and align their trades with broader market realities.
Successful trading is rarely about one technique alone; blending candlestick insights with disciplined habits and fundamental knowledge offers greater chances of consistent profits.
By recognising these challenges and applying practical tips, traders on the NSE and beyond can improve their use of reversal candlestick patterns for better trading outcomes.
📊 Learn how candlestick patterns reveal market moves in Kenya's trading space. Spot trends, master common types, and trade smarter with key tips.
📈 Learn to spot key candlestick patterns in forex trading to improve your entry and exit points. Includes tips on confirmation signals and risk management.
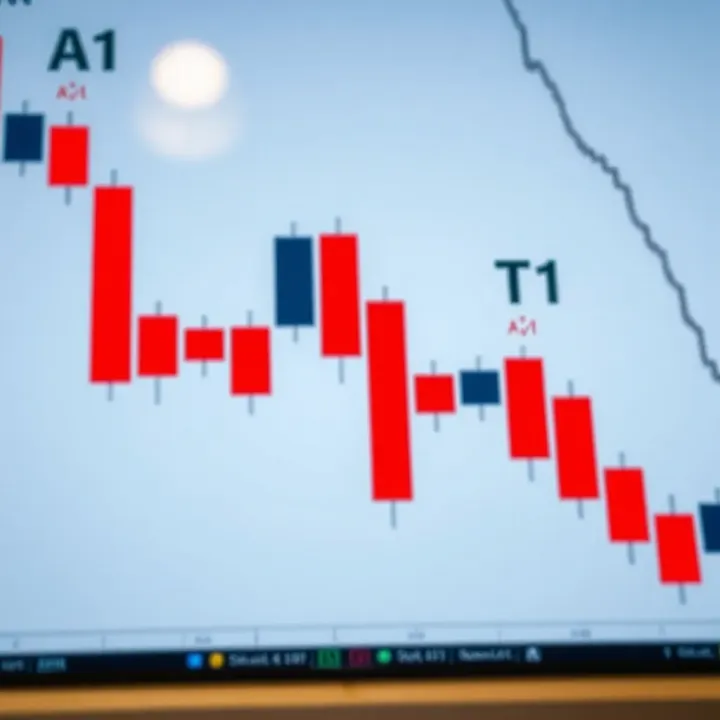
Learn how to spot bearish candlestick patterns 📉 and improve your trading skills in Kenya by recognizing signals for market reversals and managing risks effectively.

📊 Master chart patterns to boost your trading skills in Kenya. Learn to spot trends and make informed decisions with practical tips for market moves.
Based on 6 reviews